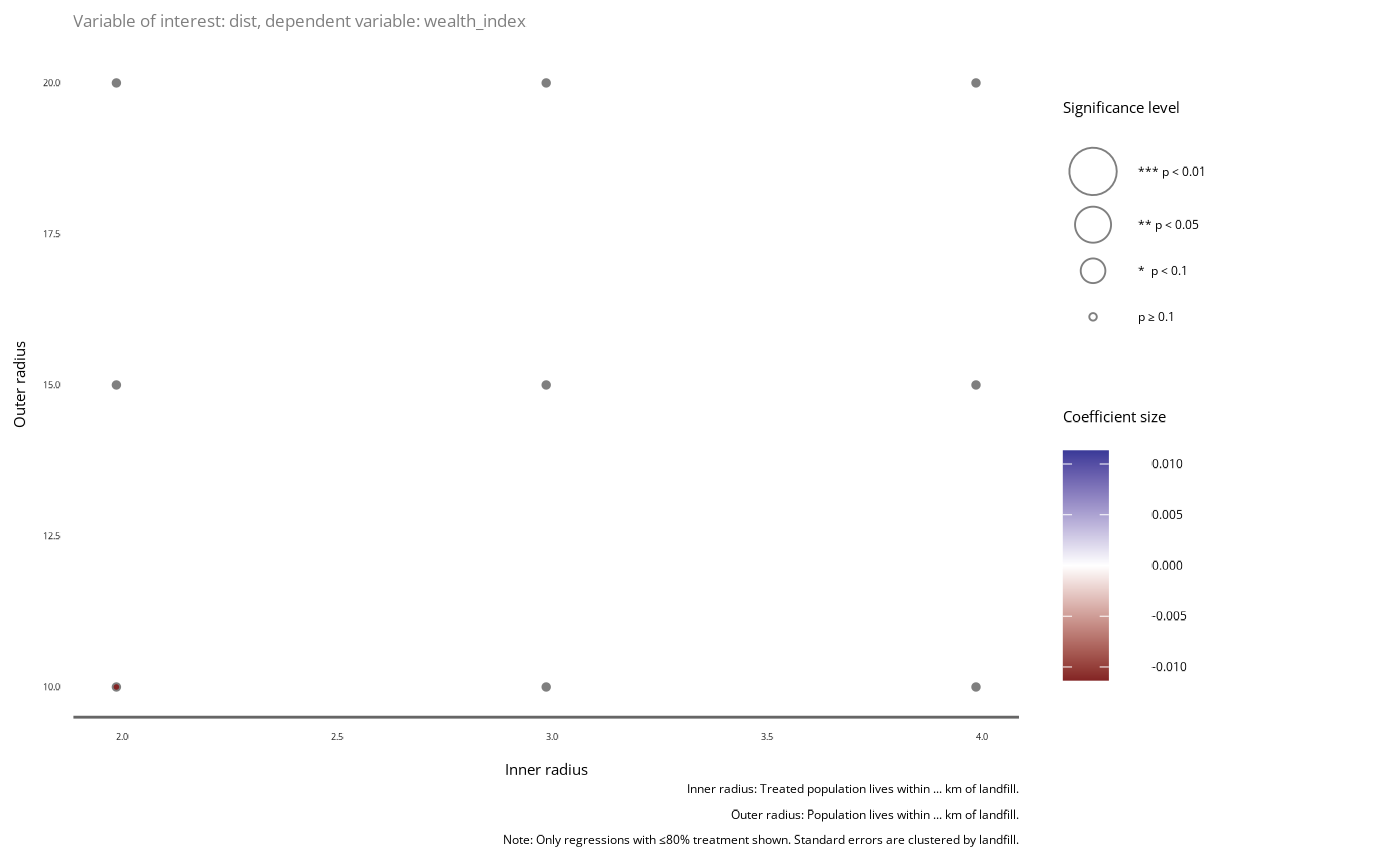
Extract distances from donut_analysis model
plot_significance.RdConvenience function to extract distances from donut_analysis model.
Input needs to be a (list of) donut_analysis models.
Consider adding theme(legend.text.align = 1) to right-align the p-value legend.
Arguments
- donut_models
List of
donut_analysismodels- var
The dependent variable in all
donut_analysismodels which should be plotted.- filter_80
Boolean: Should only those regressions be displayed for which the treatment group is >= 80% of the whole population? Defaults to
TRUE.- p_value
Alternative to
donut_models: already ready p-value data set.- dep_var
If
p_valueparam is chosen: dependent variable. Character.- se
If
p_valueis chosen: How standard errors are corrected. Character.- ...
additional parameters to be passed to
ggplot
Examples
data(donut_data)
models <-
donut_models(inner = 2:4, outer = c(10, 15, 20), ds = donut_data,
dep_var = "wealth_index", indep_vars = "age", fe = "id")
plot <- plot_significance(models, var = "dist")
plot

plot$data |> plot_significance(p_value = _, var = "dist", dep_var = "wealth_index",
se = "Clustered standard errors.")
plot$data |> plot_significance(p_value = _, var = "dist", dep_var = "wealth_index",
se = "Clustered standard errors.")
